Hochwasserlagezentrum Lahn
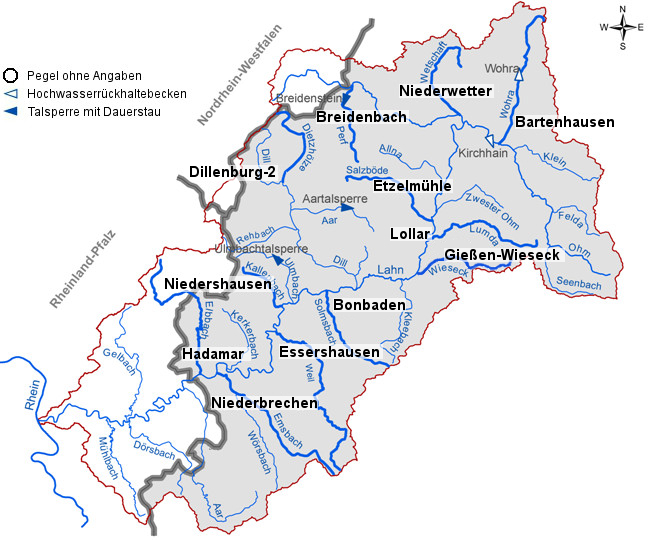
Abflussentwicklung an den hessischen Nebengewässern der Lahn
Sonntag den 07.06.2026 07:00 Uhr Wasserstände (cm) um 07:00 Uhr (VZ) Gültigkeitszeitraum für die Angabe der Prognose: 25h (Tendenz bis 08.06.2026 08:00 Uhr)
| Wasserstand (cm): |
9999cm |
bild |
| Tendenz: |
stark ansteigend |
| test |
| Gewässer |
Pegel |
Wasserstand um 07:00 (07.06.26) |
Tendenz bis 08:00 (08.06.26) |
Meldestufe |
Bemerkung |
Aktuelle Wasser- stände |
| I |
II |
III |
| | | Perf | Breidenbach | 142 |  | 240 | 270 | 310 | |  | 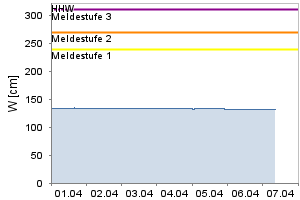 | Tendenz bis 08:00 (08.06.26) |
|---|
| | |
|---|
| | | Wetschaft | Niederwetter | 55 | | 190 | 210 | 250 | | | 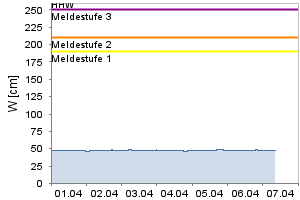 | Tendenz bis 08:00 (08.06.26) |
|---|
| | |
|---|
| | | Wohra | Bartenhausen | 144 | | 250 | 300 | 350 | | |  | Tendenz bis 08:00 (08.06.26) |
|---|
| | |
|---|
| | | Salzböde | Etzelmühle | 118 | | 220 | 260 | 300 | | | 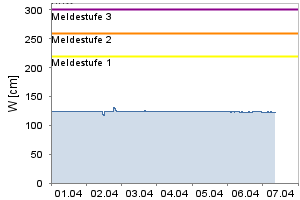 | Tendenz bis 08:00 (08.06.26) |
|---|
| | |
|---|
| | | Lumda | Lollar | 18 | | 210 | 250 | 300 | | | 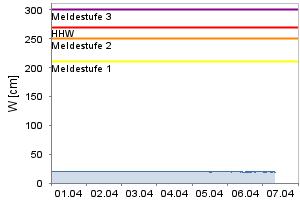 | Tendenz bis 08:00 (08.06.26) |
|---|
| | |
|---|
| | | Wieseck | Gießen-Wieseck | 15 | | 100 | - | - | | | 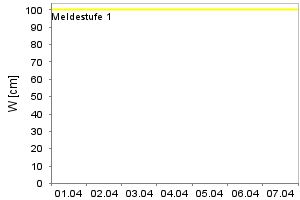 | Tendenz bis 08:00 (08.06.26) |
|---|
| | |
|---|
| | | Dietzhölze | Dillenburg2 | 24 | | 160 | 200 | 240 | | | 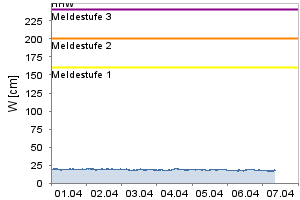 | Tendenz bis 08:00 (08.06.26) |
|---|
| | |
|---|
| | | Solmsbach | Bonbaden | 20 | | 155 | 170 | 185 | | | 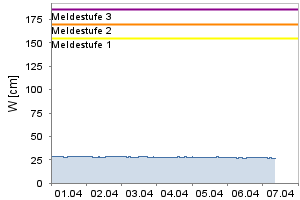 | Tendenz bis 08:00 (08.06.26) |
|---|
| | |
|---|
| | | Kallenbach | Niedershausen | 12 | | 60 | - | - | | | 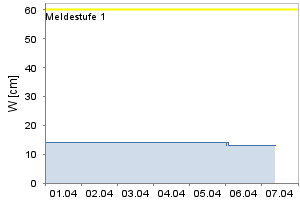 | Tendenz bis 08:00 (08.06.26) |
|---|
| | |
|---|
| | | Weil | Essershausen | 12 | | 170 | 200 | 230 | | | 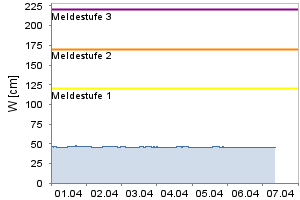 | Tendenz bis 08:00 (08.06.26) |
|---|
| | |
|---|
| | | Emsbach | Niederbrechen | 37 | | 120 | 170 | 220 | | | | Tendenz bis 08:00 (08.06.26) |
|---|
| | |
|---|
| | | Elbbach | Hadamar | 24 | | 160 | - | - | | | 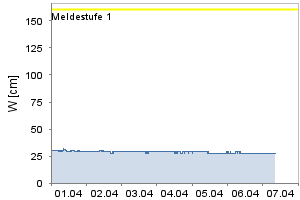 | Tendenz bis 08:00 (08.06.26) |
|---|
| | |
|---|
| Legende |
stark ansteigend |
 |
ansteigend |
 |
gleichbleibend |
 |
fallend |
|
stark fallend |
 |
VZ = Vorhersagezeitpunkt |
| Aktuelle Meldestufen: |
 = keine = keine |
 = 1 = 1 |
 = 2 = 2 |
 = 3 = 3 |
| Wasserstand - Tendenz: |
| stark ansteigend |
 |
| ansteigend |
 |
| gleichbleibend |
 |
| fallend |
 |
| stark fallend |
 |
| VZ = Vorhersagezeitpunkt |
|